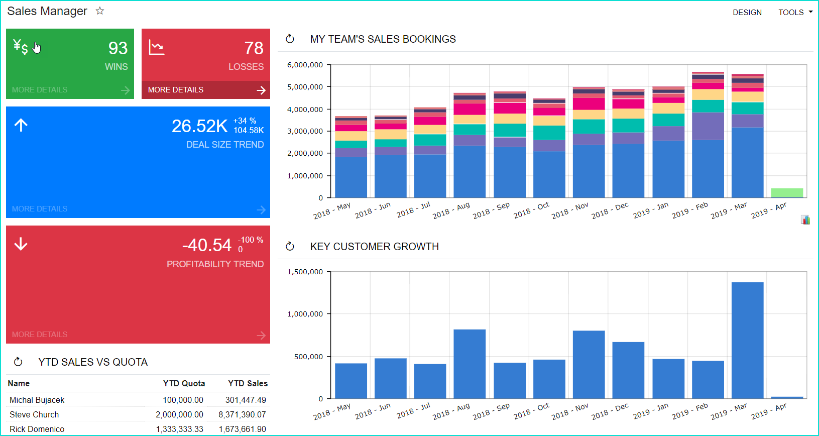
Most clients want the robust dashboard capability and Acumatica’s web-based ERP can deliver this. An advantage of dashboards is they deliver access to real-time information in consumable bites. As soon as you log into Acumatica through your web browser you are able to view your dashboards, even on mobile apps.
Are you ready to move away from general reporting and make this powerful tool work for you? Read on to learn more about my number one tip that can help you. Are you ready?
Keep it simple– If you’re thinking, “That’s your tip!” Yes, absolutely it is. You see, most people that convert from legacy systems to Acumatica start out thinking that they need to replicate every report they have in their former system. This is not what you want to do. You are moving from your old system for a reason, so why not rethink how you consume information now vs how you have in the past. You don’t need to spend over an hour producing lengthy reports anymore, although it may still have its place for some specific presentations. But, for day to day consumption of data, dashboards are a powerful tool.
Think of how much time you take to read a report. If your report is a document that you constantly refer to and the data is relevant for more than a week, then keep it as a report. However, if the report is reproduced daily for it to stay relevant, then it should be on a dashboard.
With our experience, we have seen that people have made the switch to dashboards love it. The hard part is having too much information, but my recommendation to you, again, is to keep it simple. No one likes a cluttered desk, you don’t want to clutter your dashboard either, so make sure you prioritize your dashboard with information that is not critical to how you plan your day, but with information that is nice to have.
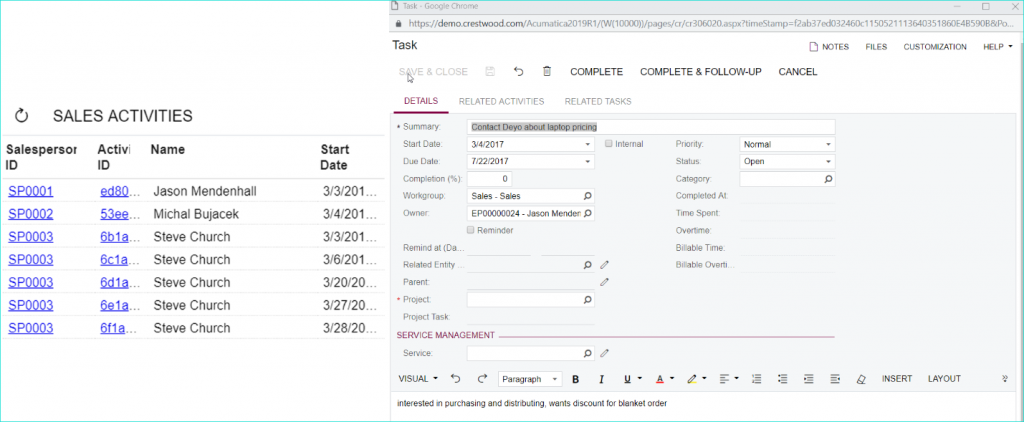
So where do you start? Consider what is critical for your success. Is it seeing a list of to do items? If so, then add a Data Table widget (which is a dashboard item) connected to Sales Activities, for example. This way you can drill into this activity, update it and move on to the next task.
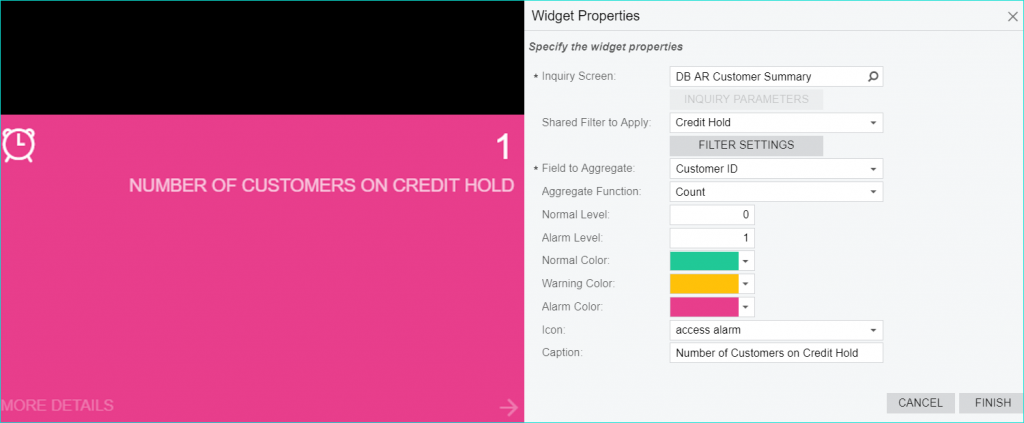
If you need information that requires your immediate attention, maybe just an alert about changes in your business, you can add this to your dashboard in a form of a KPI. For example, Customers on Credit Hold. Whether it is one account or 50 accounts, you can set up colors and alarm levels that suit your business.
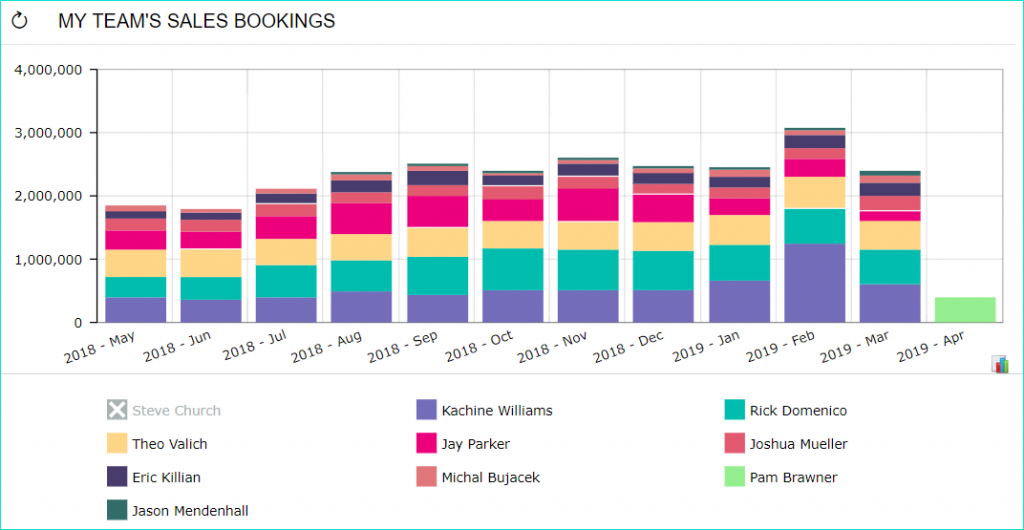
Viewing Dashboards in Acumatica on the fly became easy. You can now modify the information you are consuming by creating a widget on your dashboard that provides a chart with segmented data, for example, sales by sales person. You can pick and choose which sales associate’s numbers you want to temporarily eliminate from the chart view.
Remember, keep it simple, whether it’s a list, a chart or a KPI. Create a dashboard that is meaningful to your role and your business.
For more information about how Acumatica Dashboards can work for you and your business or more tips and tricks, subscribe to Crestwood’s blog.