
The Challenge of Inconsistent Sales
Sales consistency is a dream for any business—steadily high customer purchases, ever-popular products, and consistently successful sales teams. However, the reality of sales is marked by fluctuations. Customer preferences shift, new competitors arise, and even the best salespeople can face slumps. While businesses can’t always control these changes, they can certainly identify, analyze, and address them. The secret lies in having reliable and timely access to critical sales data.
Identifying Sales Fluctuations
To tackle sales variability, organizations must pinpoint where these changes are happening. Key questions include:
- Are certain products gaining or losing popularity?
- How do seasonal trends impact sales of specific items?
- Are some customers increasing or decreasing their purchases significantly?
- Have some sales reps seen notable changes in their performance?
Sales figures alone lack context. For instance, a product generating $500,000 in sales this year might seem impressive if last year’s sales were $350,000, but disappointing if the previous year’s sales were $625,000. Therefore, comparisons and variances are essential to make sense of the numbers. By comparing data over user-defined time periods—be it monthly, quarterly, or yearly—businesses can evaluate performance, spot trends, and take action.
Benefits of the Year Over Year Variance Report
DataSelf’s “Year Over Year Variance” (YOY) Report is designed to provide these critical comparisons. Decision-makers find this tool invaluable for identifying significant deviations early, allowing prompt responses to both positive and negative changes.
Customizable Selection Criteria
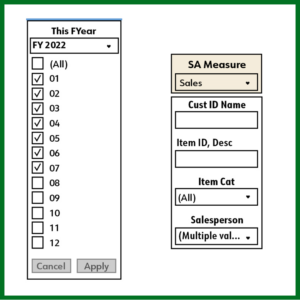
The YOY report pictured above compares sales for the first seven months of the current year against the same period in the previous year, focusing on sales revenues. However, users can customize the report to analyze other metrics such as cost of sales, gross profit, and quantity sold. The selection criteria are flexible, allowing adjustments to time ranges, customer segments, product categories, and sales personnel without any programming knowledge.
Comprehensive Analysis from Top to Bottom
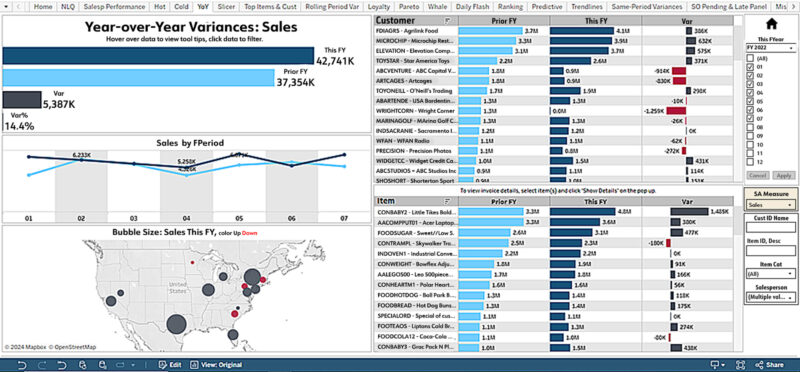
To fully understand sales fluctuations, it’s essential to start with a broad overview and drill down into specifics. The YOY report does just that, beginning with total sales comparisons and then breaking down data by month, region, customer, and product.
Infinite Drill-Down for Detailed Insights
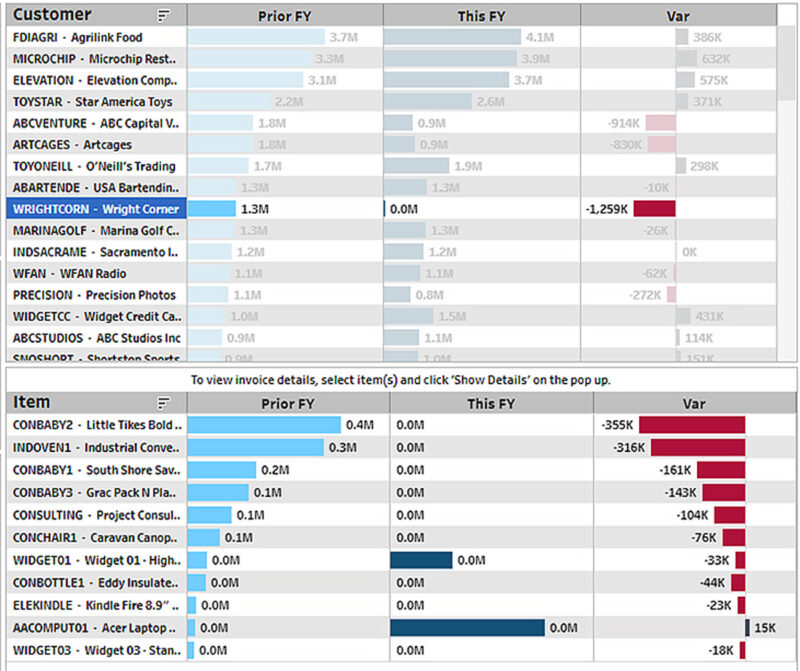
A standout feature of DataSelf’s report is its infinite drill-down capability. Every data point is interactive, allowing users to include or exclude specific metrics like year or month. Hovering over data points reveals detailed information, such as sales totals and variances. This level of detail is crucial for pinpointing where sales are changing.
For example, if a significant client like “Wright Corner” shows a steep decline in sales, users can drill down to investigate specific product sales, enabling a targeted response.
Making Informed Decisions
DataSelf’s YOY Report is more than a tool for identifying fluctuations; it’s a comprehensive solution for understanding their nature and causes. It helps determine if sales variances are cyclical, seasonal, or geographically concentrated. It reveals patterns among successful or struggling products and customers, and evaluates whether specific salespeople or clients are experiencing widespread issues or isolated ones.
By leveraging the YOY report, businesses can precisely identify where sales are fluctuating and use this insight to address challenges and make informed decisions. It ensures visibility of critical data, empowering organizations to anticipate, recognize, and respond to sales trends effectively.
View DataSelf’s Year over Year Variances Dashboard in action: