
Going Beyond Standard A/R Aging
While Acumatica’s standard A/R Aging reports show which customers are past due, how many days overdue, and how much they owe, these reports alone don’t give you the full picture. For a more strategic collections process, businesses need aggregate behavioral insights.
For example, comparing the ratio of high-risk to low-risk receivables across customer segments helps bring anomalies to light. A rise in high-risk debt isn’t necessarily a red flag, unless it’s growing faster than your low-risk receivables. With Acumatica-integrated BI tools like DataSelf, you can easily track these ratios and monitor overall A/R health.
Trend Analysis Over Time
Evaluating collections performance over time is key. Instead of focusing only on current A/R data, compare it to past performance, such as aging trends over the last 3, 6, or 12 months. This historical context helps you identify emerging patterns in customer behavior, so you can proactively manage receivables and avoid surprises.
Use Visuals for Clarity
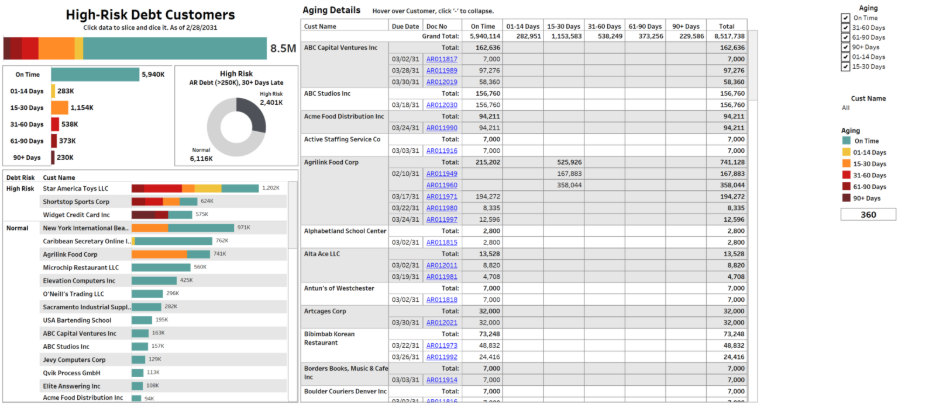
When it comes to collections, visuals often communicate more than numbers alone. BI dashboards that feature heat charts or risk matrices allow your finance and collections teams to quickly identify areas of concern.
Color-coded visuals can also help distinguish between low, medium, and high-risk debt, giving your team immediate clarity on which accounts may require follow-up, escalation, or referral to collections.
Don’t Just Look at Clients – Evaluate Staff Performance Too
Success isn’t about only your customers’ willingness to pay; it also reflects the collections effectiveness of your internal teams. With BI tools connected to Acumatica, you can analyze receivables performance by sales reps, account managers, and entire departments.
Identifying who consistently collects faster or manages accounts with lower delinquency helps surface best practices and opportunities for staff training. You can also tie these insights into incentive programs to drive stronger collections performance across the board.
Track DSO (Days Sales Outstanding) and Make It Actionable
DSO is one of the most important KPIs in collections. It tells you how long, on average, it takes customers to pay their invoices. In Acumatica, tracking DSO over time with BI-based analytics allows you to quickly identify whether your payment cycles are improving or deteriorating – and take appropriate action.
Spot the Outliers
Sometimes the biggest collections risks come from the smallest details. BI tools can help identify anomalies in your A/R, such as a client with a disproportionately high share of overdue invoices or unusually slow payment behavior compared to their peers.
These anomalies often indicate deeper risk and may warrant a change in terms, escalation, or closer monitoring.
Leverage Acumatica + BI for Smarter Collections
Acumatica’s open architecture and powerful data structures make it an ideal platform for BI-powered collections analytics. With tools like DataSelf Analytics for Acumatica, you can go far beyond static reports to uncover real-time trends, risks, and opportunities in your receivables portfolio.
Curious how your A/R risk really stacks up? The ‘High-Risk Debt Clients’ dashboard in DataSelf shows you exactly where problems are brewing, before they hit your bottom line.